Real-time information access to provide faster, more accurate solutions to neonatology's most complicated problems.
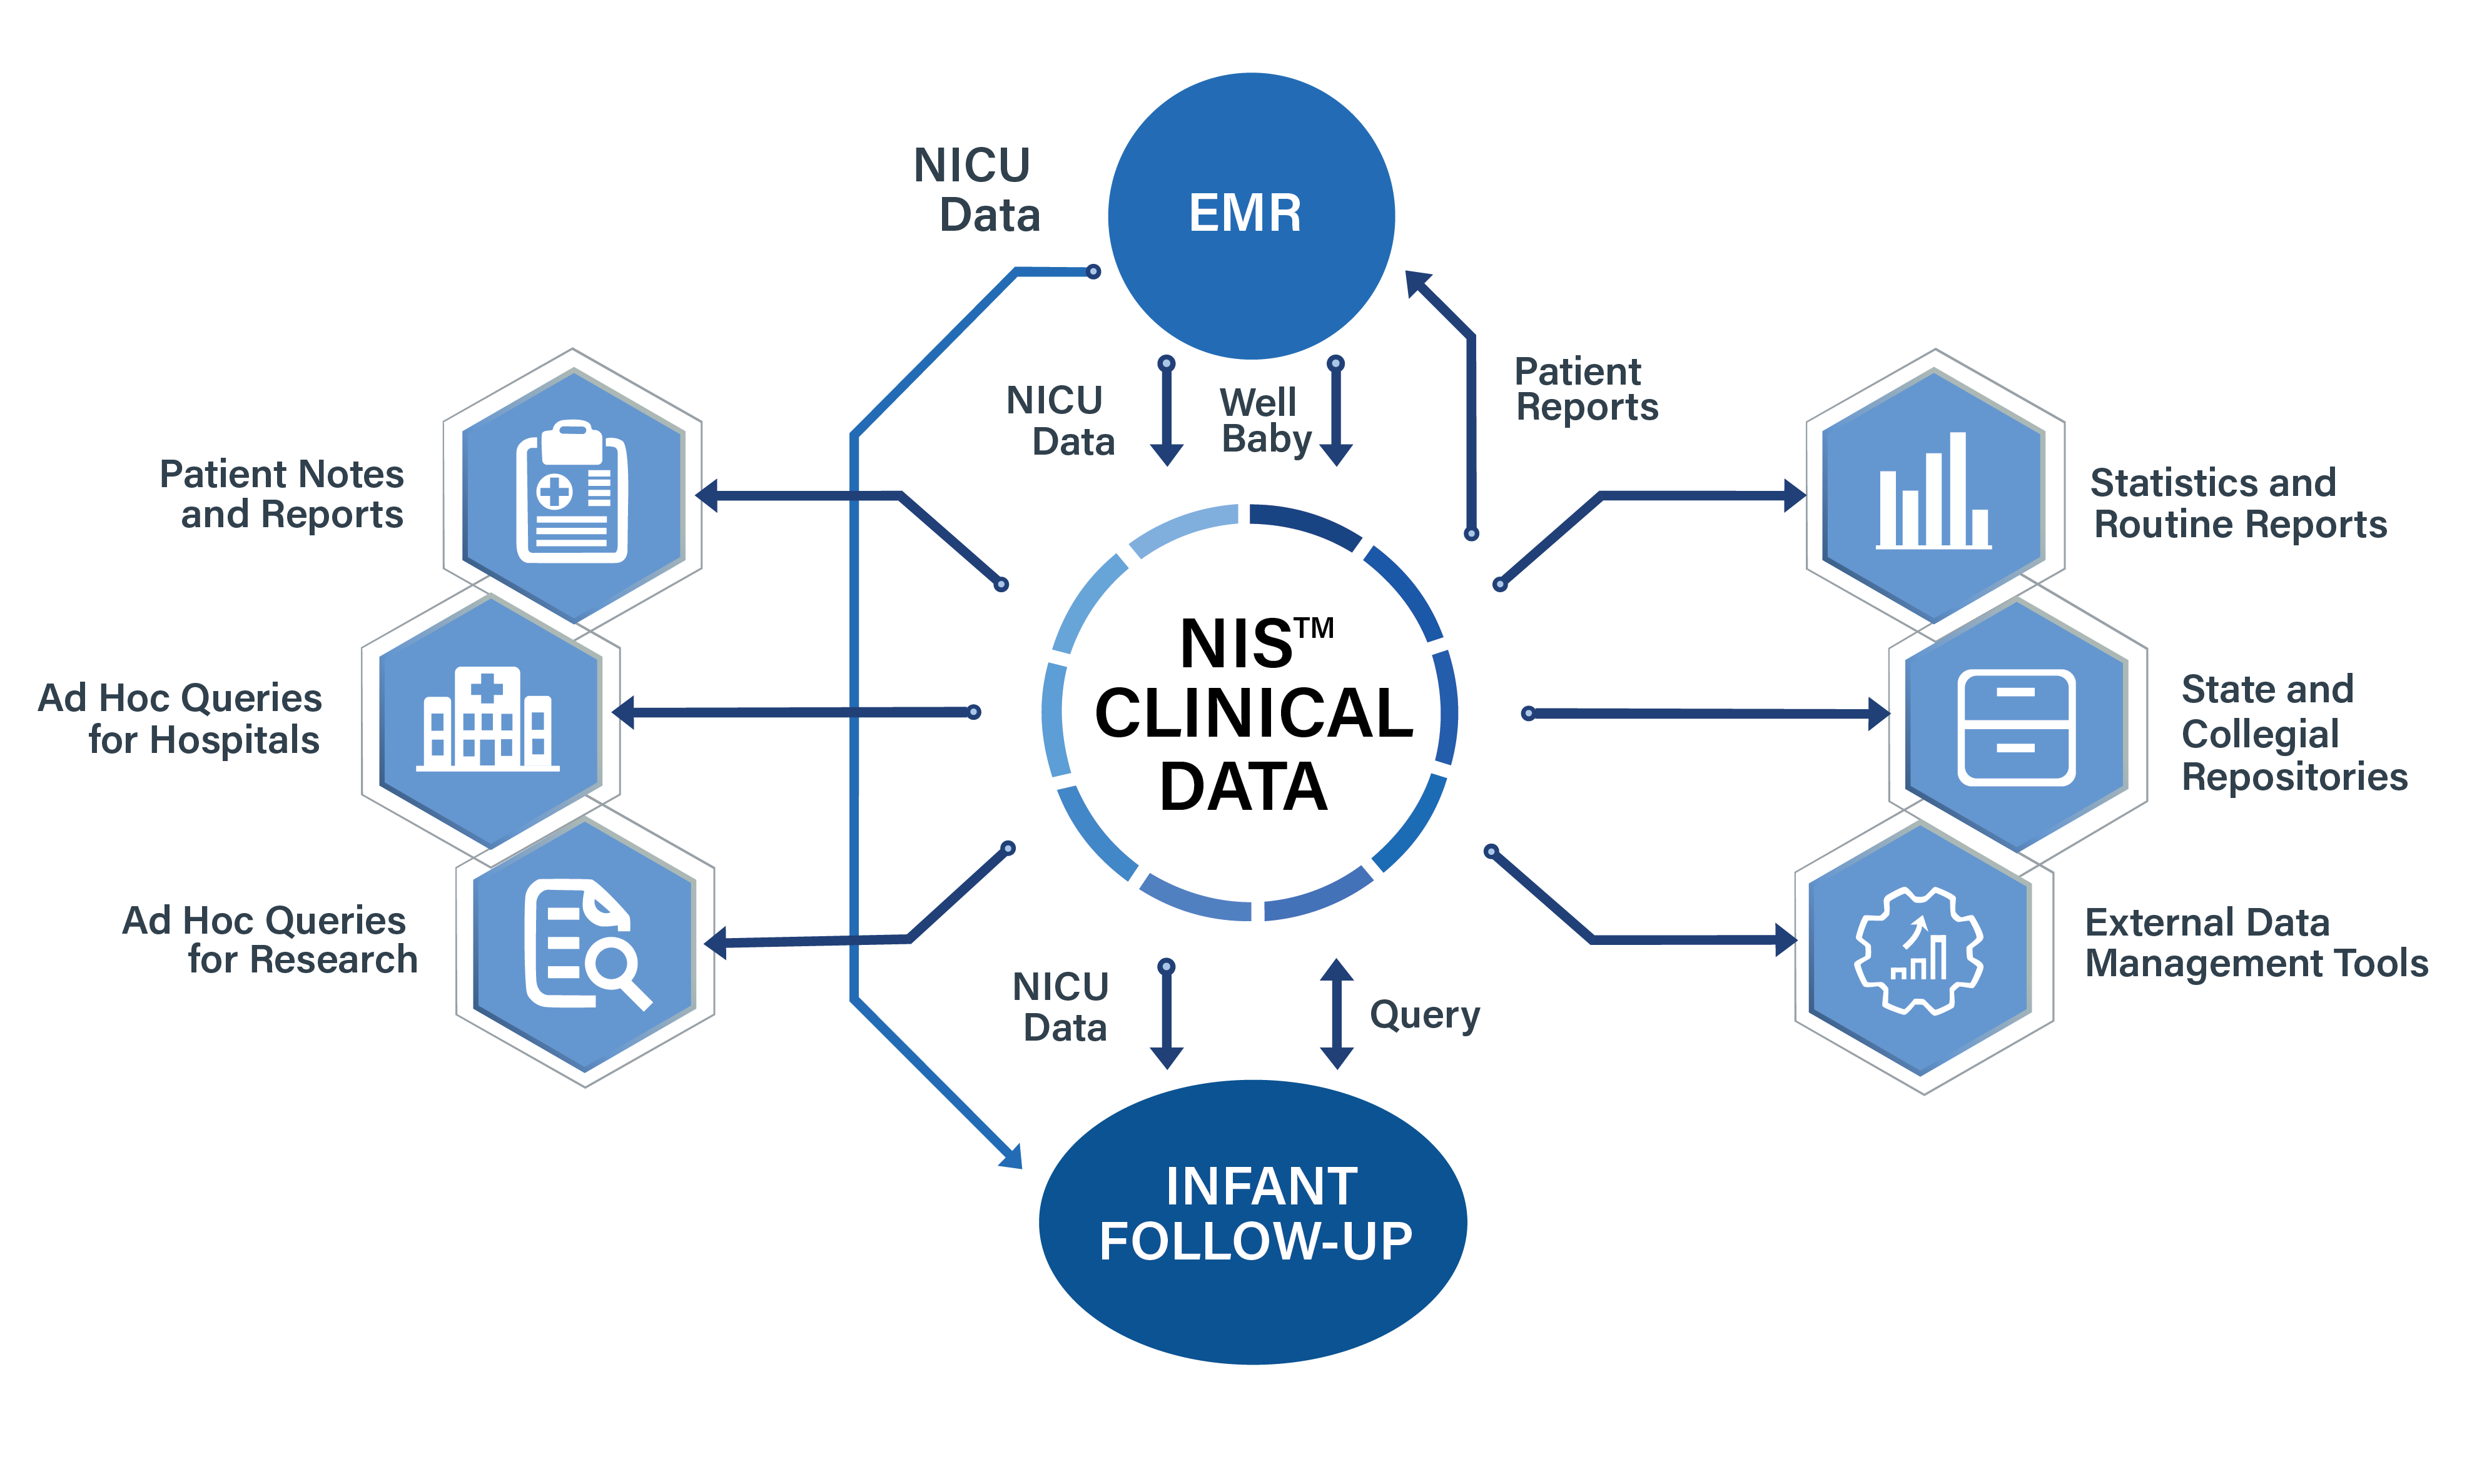
Integration with EMRs and other systems. The NIS™ can receive or share information with existing hospital information systems.
Export to Repositories - such as the VON eNICQ, the New York State Department of Health, Regional, State and National Repositories.
Accurate, efficient, secure, and affordable solutions for accessing your patient’s information in real-time.
Applications for NIS™
The NIS™ provides a sophisticated and robust system for analytical functions at little lead time to support:
Safety
Patient Care Decision Support
Quality Indexing
Clinical Research
Routine Divisional Reporting
Operations
Contain costs by interfacing the Neonatal Information System™ with your hospital’s EMR. Produce any kind of report that you need now without incurring additional IT costs.
MDS EMR to NIS™ interfaces are certified by Epic. We can also interface with virtually any EMR (Cerner, Iguana, Cloverleaf, Corepoint, etc).
Export data to state, regional and national clinical performance benchmarking repositories.
Epic is a registered trademark of Epic Systems Corporation
Complex Situations. Powerful Solutions.
Medical Data Systems Software
Clinical Information Solutions for Neonatology from Medical Data Systems
Since 1985, MEDICAL DATA SYSTEMS has worked closely with neonatologists, nurses, hospital administrators, IT, and EMR personnel in hundreds of newborn intensive care units to develop innovative solutions for the management of complex clinical data for well and critically ill newborns and infant follow-up.
Neonatal Information System™ – from Perinatology, the NICU and well-baby experience through Infant Follow-up – the NIS™ will meets all of your on-going and ad hoc reporting requirements.
Our Commitment
MEDICAL DATA SYSTEMS is committed to using emerging technologies to our client’s advantage. We offer total access to critical information to provide you with faster, more accurate, and cost containing information for the complete spectrum of your reporting requirements.
The people behind TMGvets don't just want your business, they want the longterm relationship. They delivered what they promised. No gimmicks, no hidden fees, what you agreed upon is the real deal, year after year. Thank you TMGvets!
Everything they promised in their marketing has been absolutely true. My account was setup and equipment installed seamlessly. When John left my practice, he gave me their direct service line, not a 1-800 number!
TMGvets has handled my veterinary clinic's merchant services for just over a year now and they have been virtually flawless. There are none of those 'hidden fees' that I have had to deal with so many times before and their customer service is excellent.
Excellent customer service. Daily reports that are extremely easy to read. A significant savings compared to other companies. Highly recommend seeing if they can save you money on your payment processing.
Get Started With NIS
Simply put - the Neonatal Information System™ is the most comprehensive clinical information management system available today; incorporating information from all aspects of clinical care for critically ill newborns in the NICU.